Build a Winery DTC Sales Dashboard in 30 Minutes
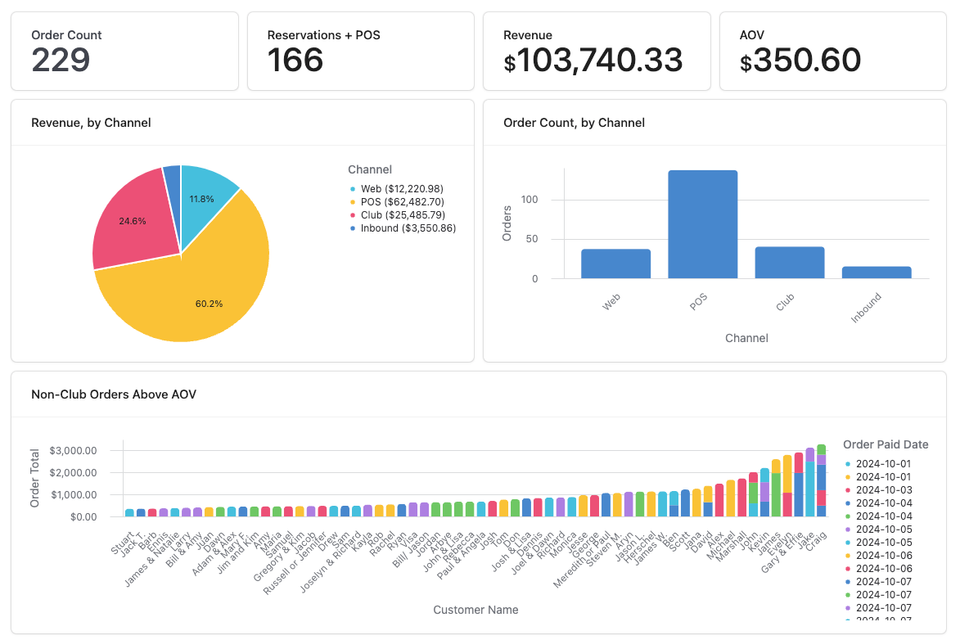
This is a practical guide for beginners (with tips for pros too) to start being more "data-driven".
👋 Welcome to New Vintage, a weekly taste of tech for wine professionals to level up with no-code and AI tools.
BE DATA-DRIVEN, they say! Oh, the tired overture of industry conference sessions, vague thought leadership pieces, and articles sponsored by analytics software companies.
We all know we can learn from the data within our business, but we don't need more people shouting that we should.
What I haven't seen, though, is enough practitioners demonstrating how to do that.
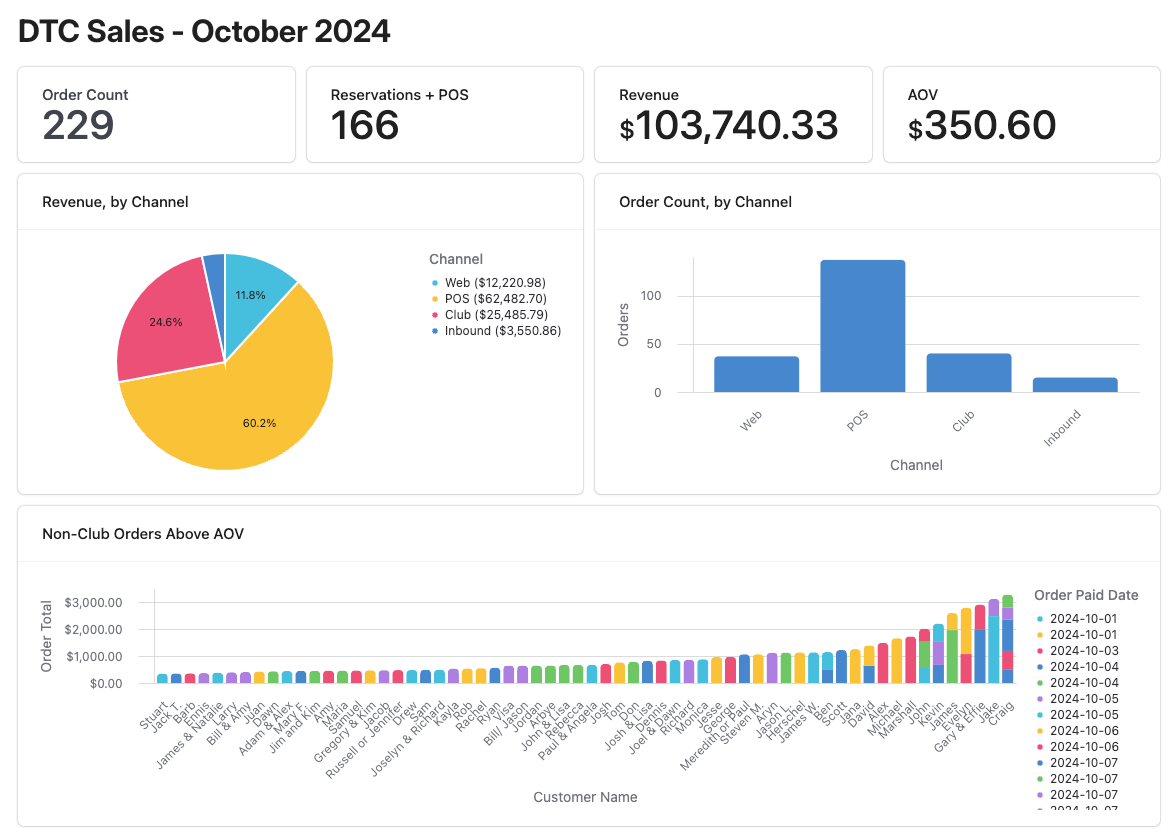
Today, we're starting simple: one Commerce7 export, one Airtable base, four key metrics, and three insightful visualizations that will give you a clear monthly picture of your Direct to Consumer (DTC) business. This isn't meant to be comprehensive - think of it as your 'minimum viable dashboard' that you can build upon as you develop your data muscles.
After all, the best dashboard is the one you'll actually use (looking at you, past me, building 100 different views).
What You'll See
We're going to build a one month view of DTC sales that shows some basic revenue metrics. For this first version, let's focus on:
- Order Count: Your total transaction volume
- Revenue: Total DTC sales
- Average Order Value (AOV): The typical dollar value of an order
- Channel Breakdown: Sales breakdown by Tasting Room (POS), Web (website + Tock, if you're using), Inbound, and Club
- Top Non-Club Orders: Non-Club orders that were above average in dollar value
While this example will use an export from Commerce7, the steps are highly similar for importing any csv into Airtable.
Here's a preview of what it'll look like:
Complete 3 Part Setup
For this build, you'll need:
- A Commerce7 login
- An Airtable account (free version is fine to start)
- Note: I get a credit if you use this link, which is cool, but you can sign up via their homepage if you prefer. Steps are the same!
1. Export Your Data
- Log into Commerce7
- Go to 'Marketing' --> 'Queries'
- Click 'Add Query' and select 'Order'
- Set the conditions:
- Order Date:
- less than {end of month}
- AND greater than {beginning of month}
- AND Single Order Total is greater than {some number that would filter out mistake orders, I picked $1}
- Order Date:
- If all went well, you ended up here:
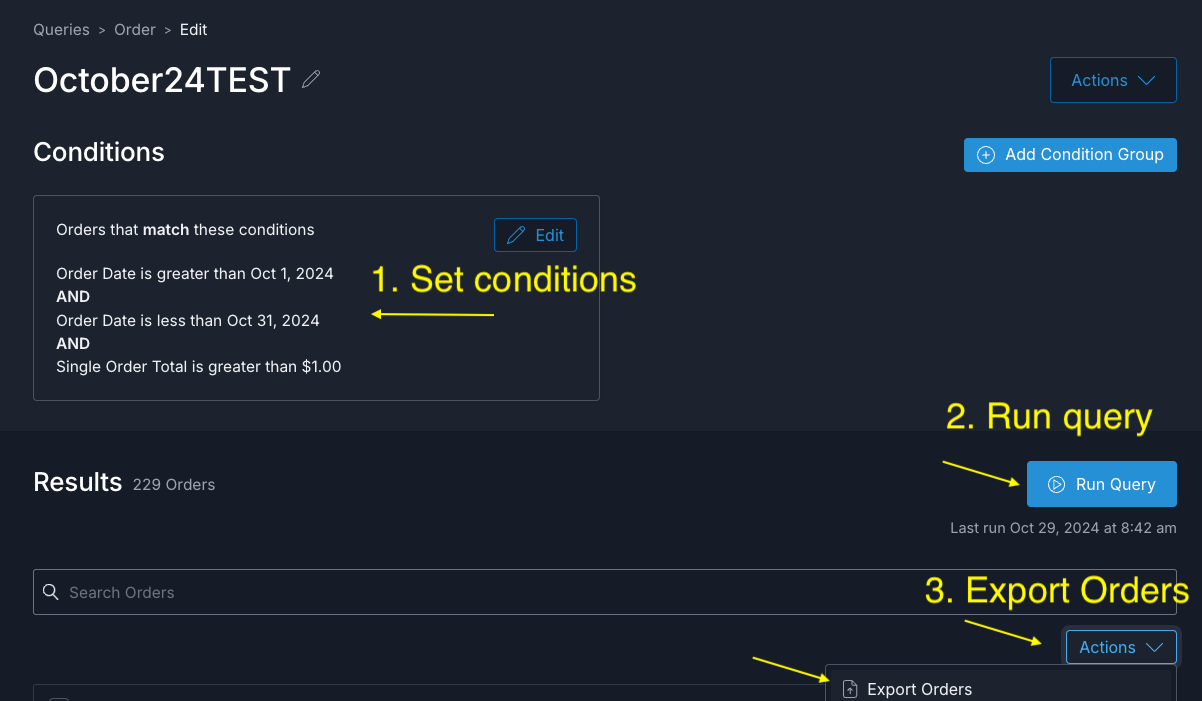
- Export your data, it will arrive via an email download link (at the time of this writing)
- Download the data from your email
Part 1 complete!
2. Create Your Airtable Base
- Make an Airtable account if you don't have one already
- Click the '+ Create' button on the home page (bottom left at time of writing)
- Click 'Start from Scratch'
- Import your new csv from Commerce7 (click either of the options shown)
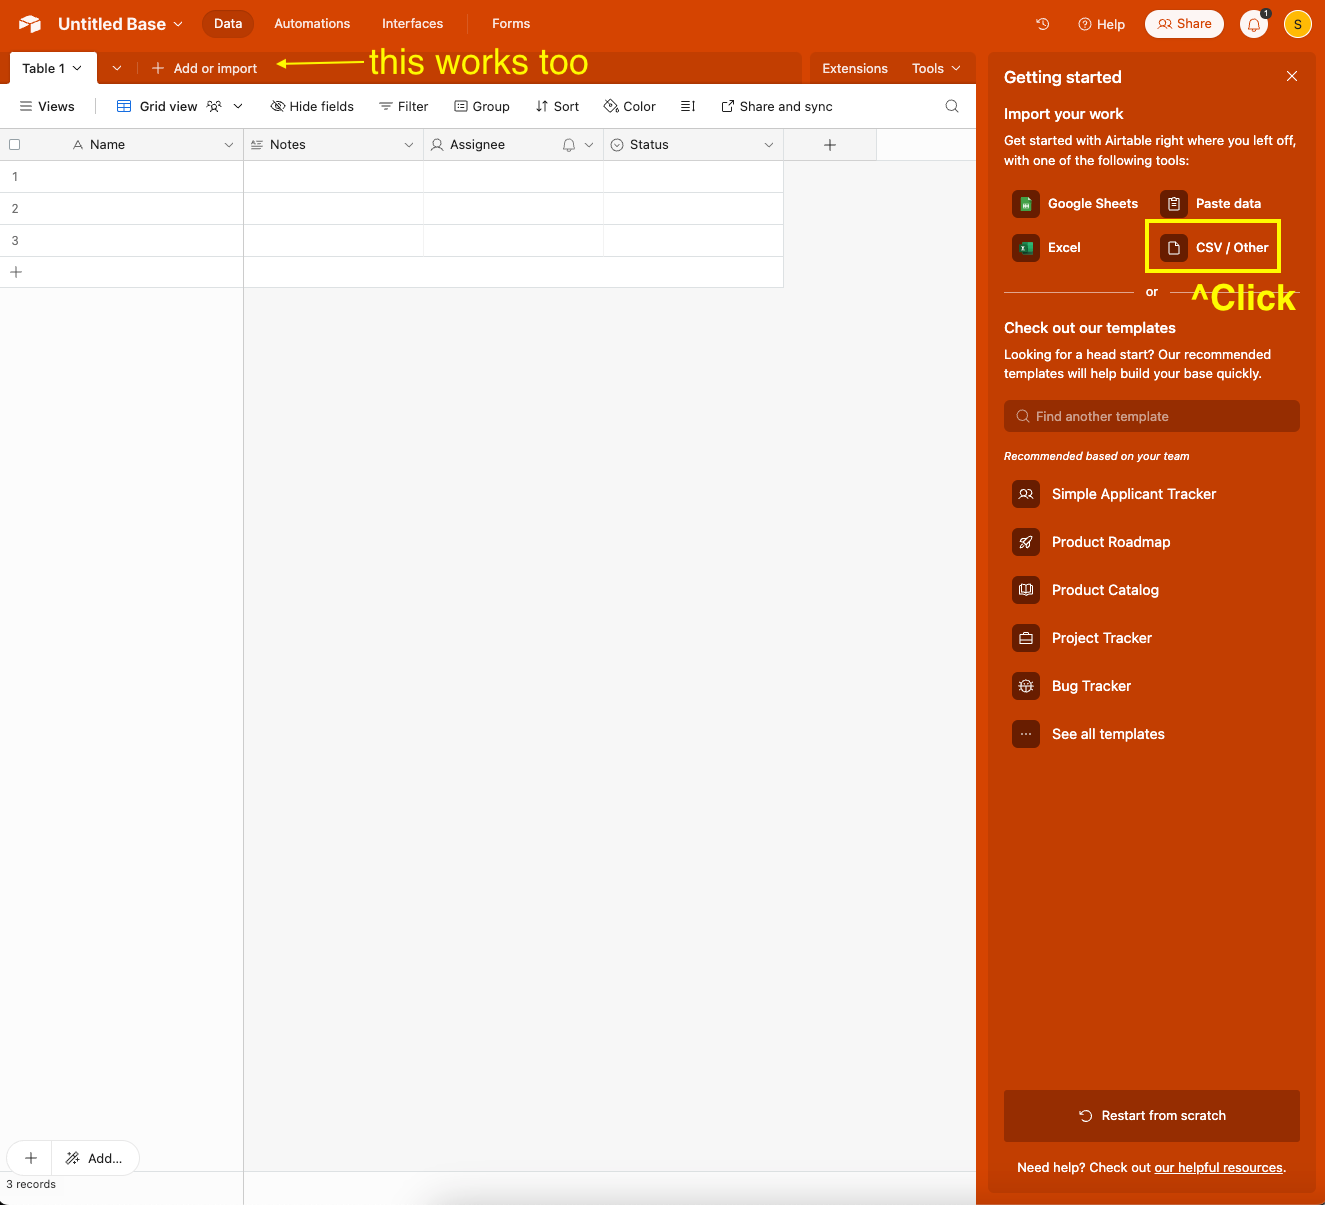
- A window will pop up showing all the fields being imported, just hit 'Import', you can edit/rename them later
- *Optional: data displays best if your 'Total' field is a currency field, to change this, right-click on the field and click 'edit' to change from number to currency *
- Once the data is imported, you should have a big table with a bunch of columns (mine had 87)
Congratulations, you just loaded all the data you need!
3. Build Your Interface
This part is lots of clicking. Hang in there, we're almost there.
- In Airtable, click 'Interfaces', then
- 'Start building'
- 'Build an interface'
- Name your interface, something like 'DTC Sales', perhaps?
- Choose the 'Dashboard' layout
- You will end up with something like this:
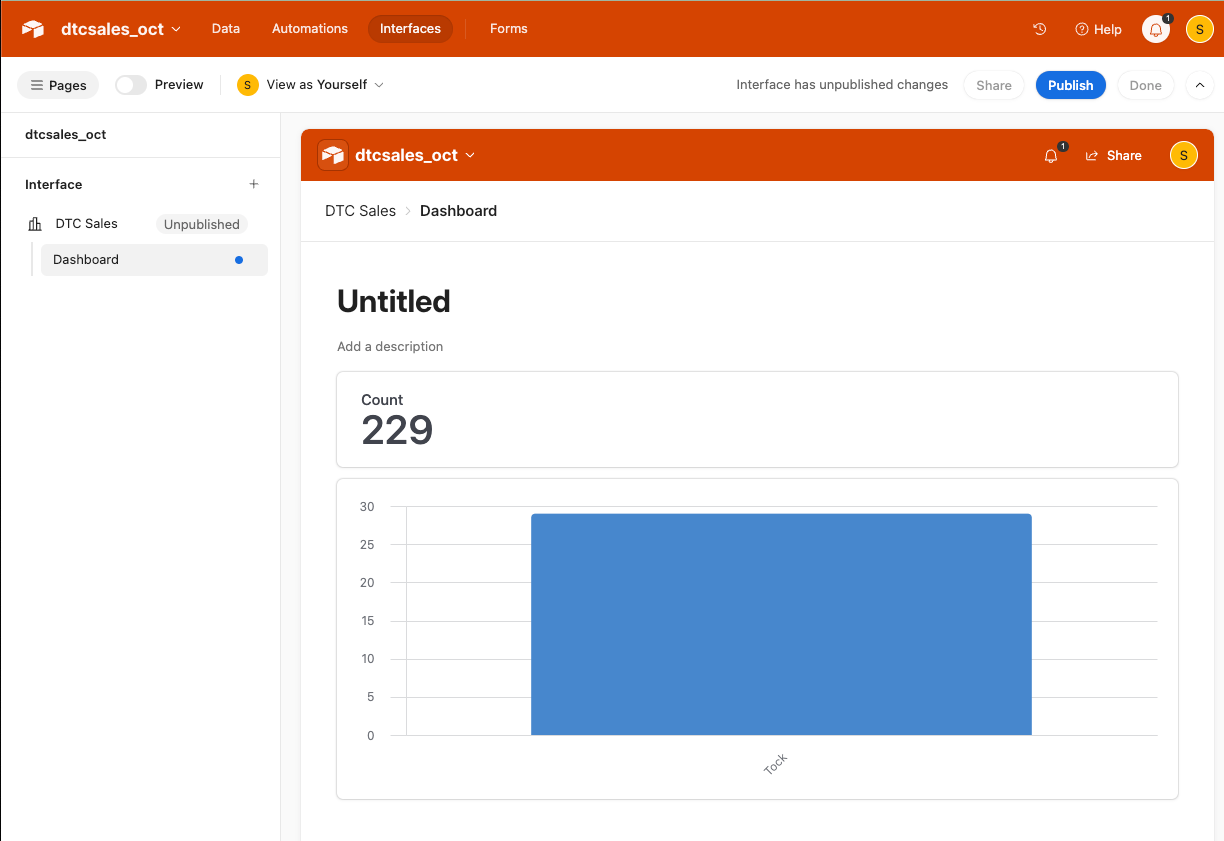
Quick orientation: clicking on any element will open up a side panel, this will be our home for the next 20 minutes. Hovering around the edges of an element will show a '+' button, that adds an element.
Starting with the top row of numbers:
- Hover to the right of our current 'Count' block to add another

- Repeat until there are 4 blocks across the top, renaming them to 'Order Count', 'Reservations + POS', 'Revenue', and 'AOV' (or whatever you like, this is just so I can refer to these names in subsequent bullets)
- 'Order Count' - total orders, filter out fake ones if you have them
- Filter by: None
- Appearance:
- Type: Count
- 'Reservations + POS' - this is to isolate orders that were likely experience reservations or POS
- Filter by:
- Where Channel is POS
- OR where External Order Vendor is Tock (you don't need this one if you're not using an external reservation system)
- Appearance:
- Type: Summary
- Field: Id
- Summary type: Unique
- Filter by:
- 'Revenue' - total revenue for DTC
- Filter by: None
- Appearance:
- Type: Summary
- Field: Total
- Summary type: Sum
- 'AOV' - average order value
- Filter by: None
- Appearance:
- Type: Summary
- Field: Total
- Summary type: Average
Next, for our three graphs:
- The same way you added the number blocks, add two more charts until you have three laid out like our example (two in one row, one below it)
- 'Revenue, by Channel'
- Type: Pie
- Data
- Filter by: None
- Categories: Channel
- Values: Summary
- Appearance
- Show record count in legend: ON
- Show percentage on chart: ON
- 'Order Count, by Channel'
- Type: Bar
- Data
- Filter by: None
- X-axis: Channel
- Y-axis (left): Id, Count
- 'Non-Club Orders Above AOV
- Type: Bar
- Data
- Filter by:
- Where Channel is not Club
- AND Customer First Name is not empty
- AND Total > {Your AOV, mine was 350.60}
- X-axis: Customer First Name (or whatever identifer you want)
- Y-axis (left): Total, Sum
- Group by: Order Paid Date (optional)
- Filter by:
Last, the pivot table:
- Add a pivot table below your graphs
- 'All Orders, by Customer'
- Data
- (Optional) Filter by: Total > {number you want to see, I did $1}
- Rows
- Field: Customer First Name (or whatever identifer you want)
- Show totals: ON
- Columns
- Field: Order Paid Date
- Bucket by: Week
- Sort by: Group
- Show totals: ON
- Values
- Summarize by: Field
- Field: Total
- Summary type: Sum
- Data
Future Enhancements
Congrats! You've set up a monthly DTC dashboard using only one report.
There's an absolute ton that you can/will do in the future to enhance this, but let's not go crazy. Save these for your future self and let me know if you want a deeper dive.
When you're ready to take your dashboard to the next level:
Data Integration
- Link multiple Commerce7 exports using Customer ID
- Connect product data for inventory insights
- Build customer profiles across transactions
- Set up automated refreshes via Airtable API
Customer Insights
- New vs. Returning Revenue Split
- Club Member Retention and tracking current tenure vs typical points of churn
- Customer Lifetime Value cohort analyis (ex. top 10%, 11-49%, etc.)
- Referral Sources
- Average Time Between Orders
- Top Non-Club Customers
- Number of Touches Before Club Signup
Automation Opportunities
- Scheduled data refreshes using Airtable Scripts or scheduled API calls
- Regular email updates to team
- Alerts for key metrics

Closing
Remember: The goal isn't to track everything - it's to start building the habit of looking at data as a team. Spend a month with these basics, note what questions come up most often, and let those guide your next dashboard additions.
Cheers,
Stephen

Comments ()