A Key DTC Metric to Track in 2025: Revenue Per Session

👋 Welcome to New Vintage, a weekly taste of tech for wine professionals to level up with no-code and AI tools.
As we kick off 2025, I want to introduce you to a metric worth adding to your measurement toolkit: revenue per session (RPS). This is a follow up to a higher level piece where we explored 5 key metrics to track and first mentioned this metric.
Revenue per session (RPS) is a high level metric that signals how well your website is selling. As it sounds, it is calculated as [website] revenue / [website] sessions.
If you're like most teams, you're already tracking various metrics in your tasting room.
You know your revenue per taster, your club conversion rates, and how these numbers trend over time. These give you signals for how effectively you're converting visitors into buyers.
Now it's time to bring that same analytical rigor to your digital storefront.
Revenue per session (RPS) serves the same purpose for your website – it measures how effectively your digital presence converts visitors into customers. Just as you wouldn't run your tasting room without tracking revenue per taster, you shouldn't operate your digital storefront without understanding your RPS.
Why This Metric Matters Now
The wine industry is at an inflection point. Opportunities in wholesale are extremely competitive, visitation numbers have been volatile since COVID, and consumers have more choices than ever.
For most brands, direct-to-consumer (DTC) is considerably higher margin than wholesale, but highly dependent on the tasting room as the primary point of conversion. Inconsistent tasting room traffic leads to variable DTC revenue.
So, in order to grow DTC, we can either sell more in person or sell more online. Effective tactics for either ultimately boil down to improving traffic quality and increasing conversion.
In the current environment, I believe that the wine brands that evolve into lovable e-commerce brands will have more control over their growth.
RPS is the online equivalent of revenue per taster, one of the critical indicators of how well we're selling online.
How to Calculate and Track RPS
Let's make this concrete.
The formula for RPS is simple:
For example: $10,000 monthly web revenue / 2,000 sessions = $5 RPS
A simple way to get these numbers is to use Google Analytics (assuming you have it set up on your website) and whatever order management system you use (I'll use Commerce7 in the example).
Google Analytics (GA, GA4)
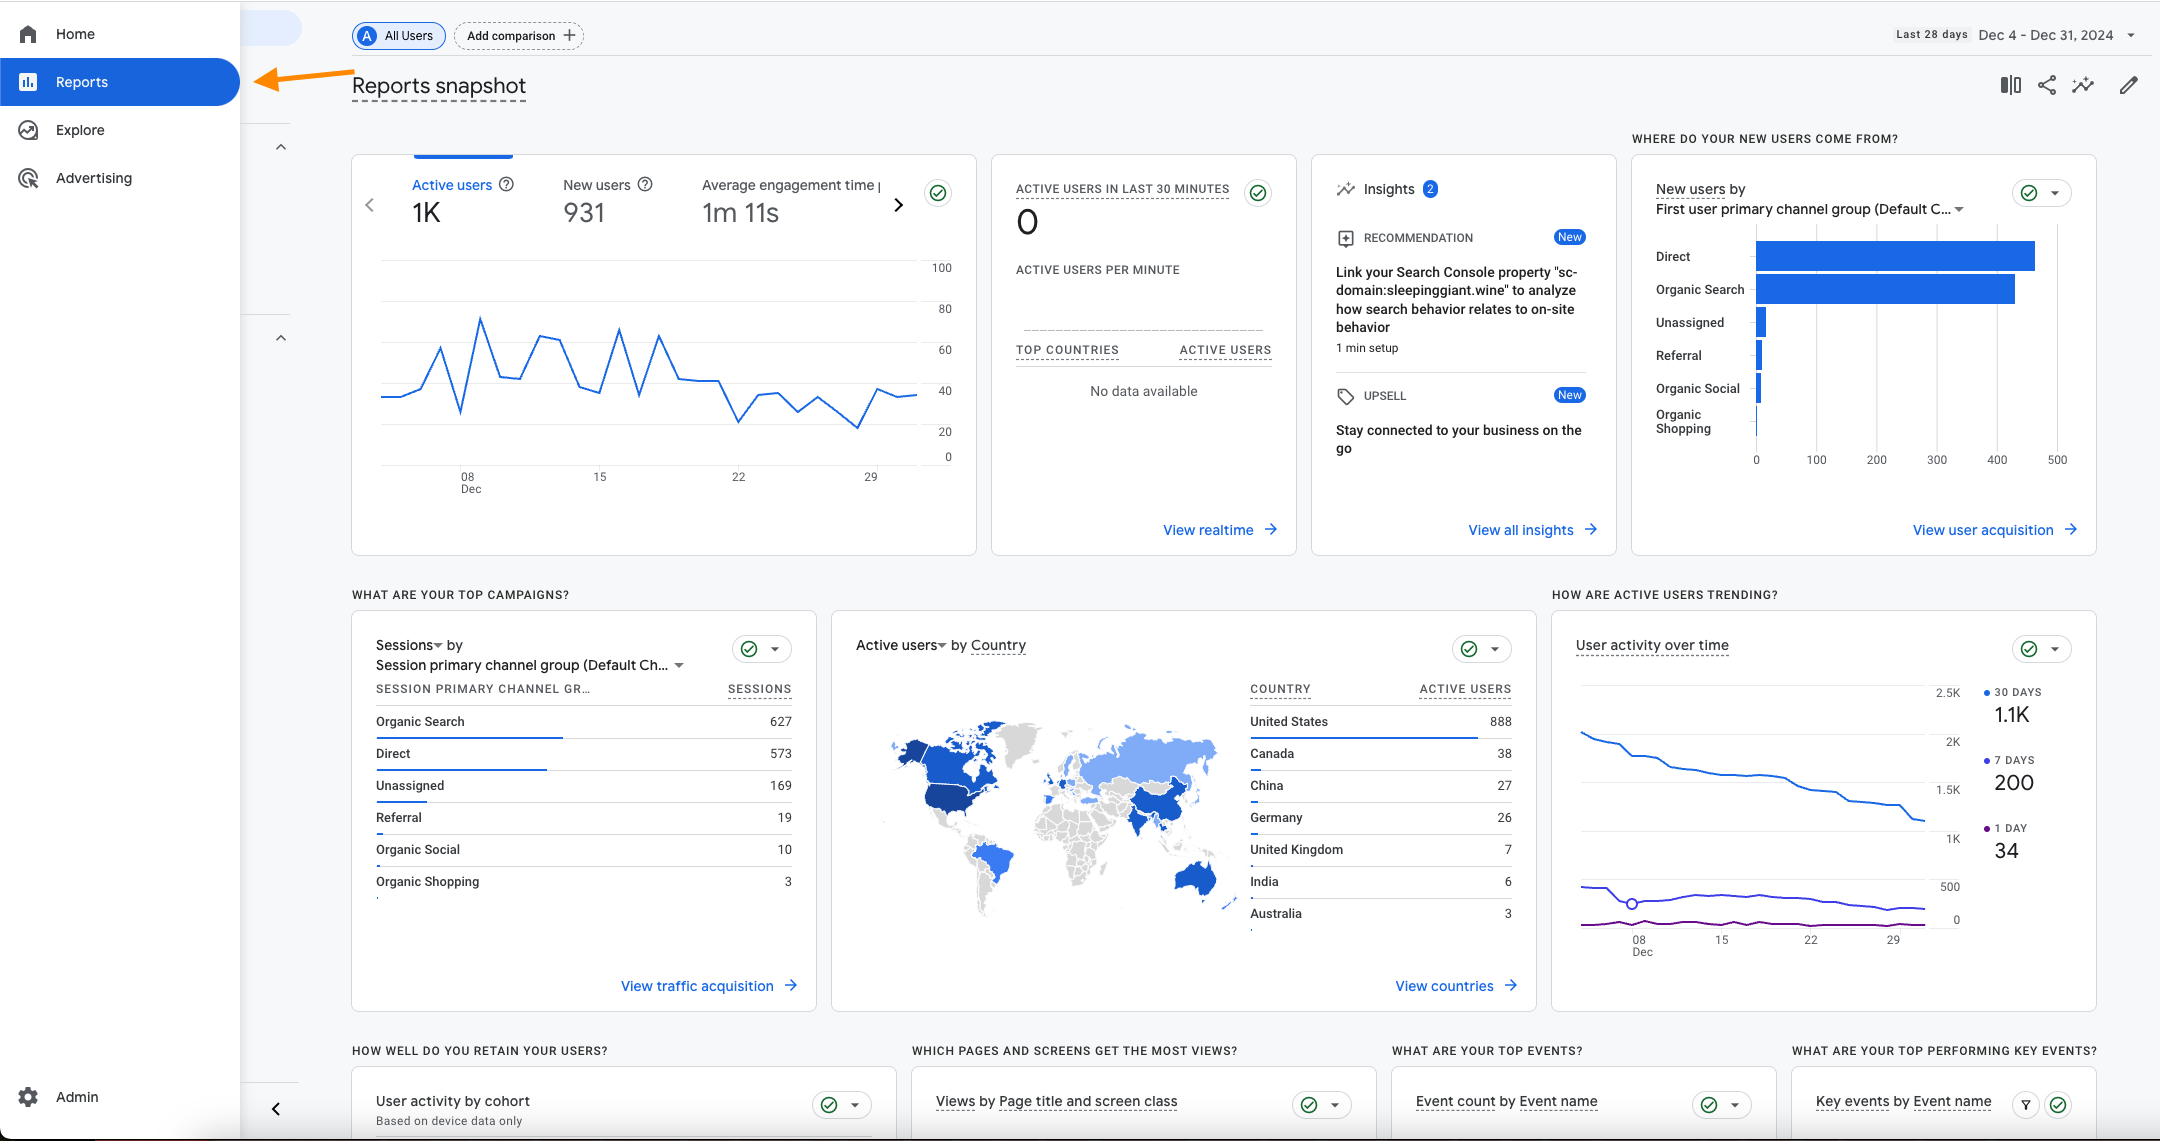
Log into Google Analytics and click on 'Reports'
Click on 'Traffic acquisition'
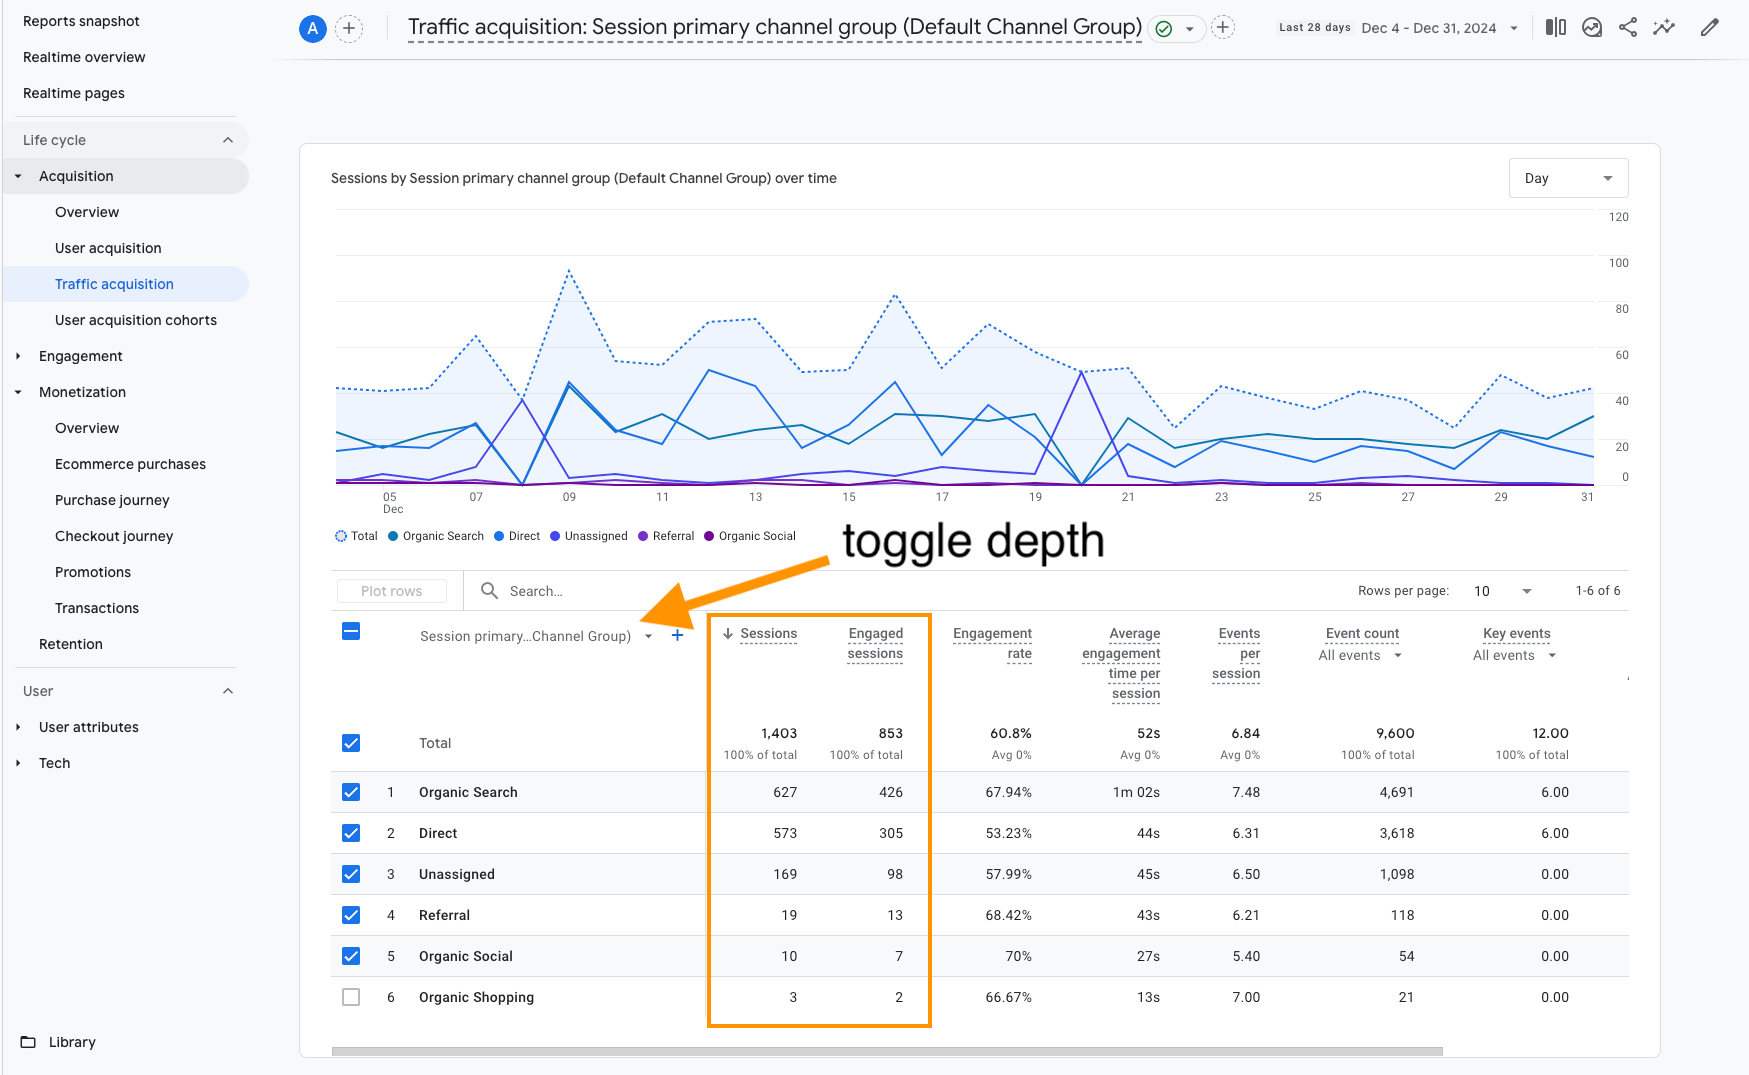
This shows you a breakdown of where your website traffic is coming from. The default view here groups the traffic by channels, such as "Organic Search".
We want to use either 'Sessions' or 'Engaged sessions' for our RPS calculations. At the time of writing, 'Engaged sessions' is recommended as it refers to sessions lasting longer than 10 seconds, containing a key event, or one with 2+ screen/page views.
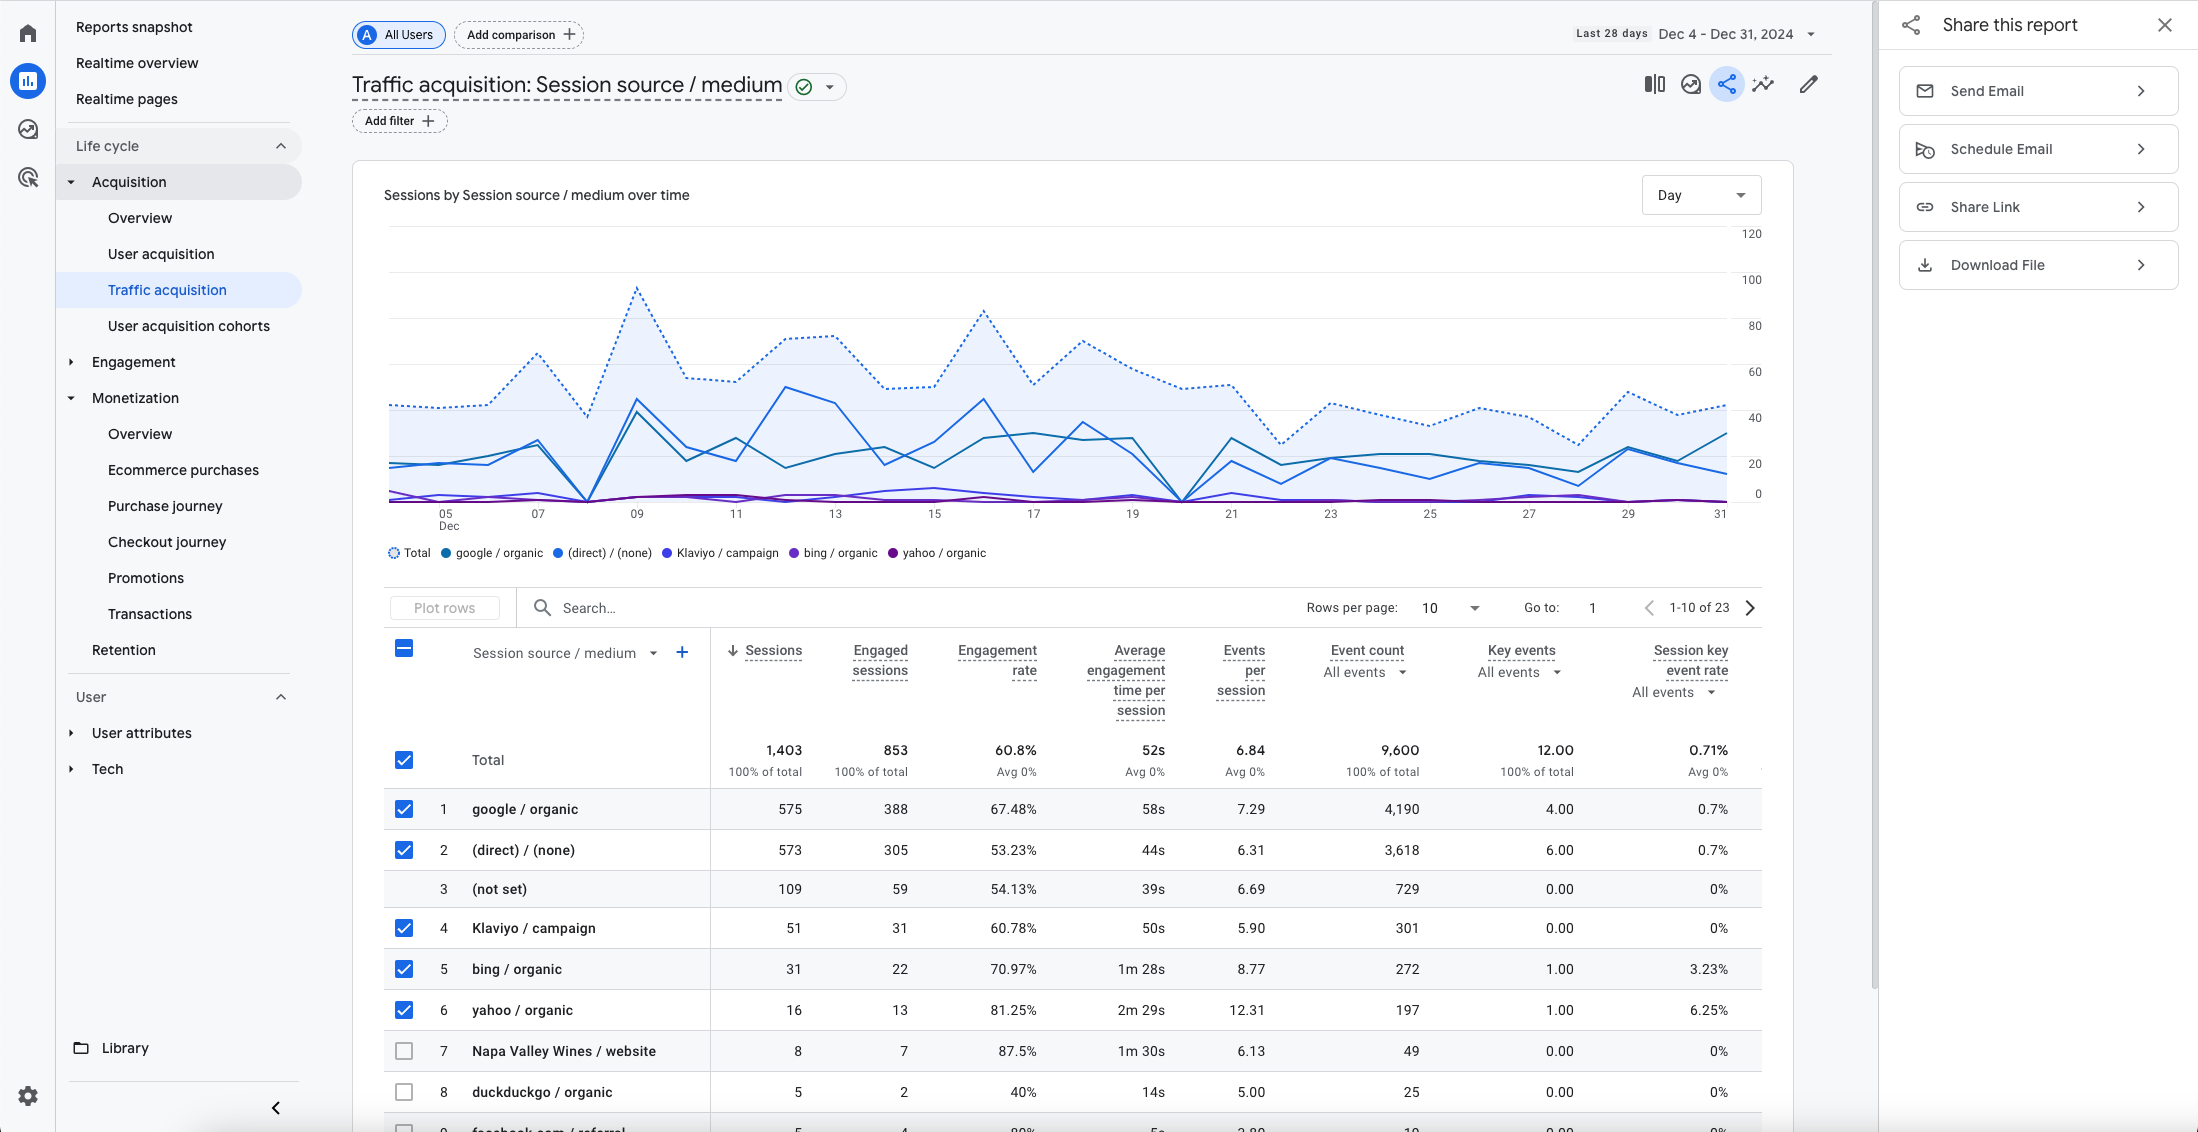
To go further, you can toggle the depth of the traffic breakdown by clicking as shown above. The example below is breaking it down by source/medium, which can give us an even more detailed view of where our website sessions originated.
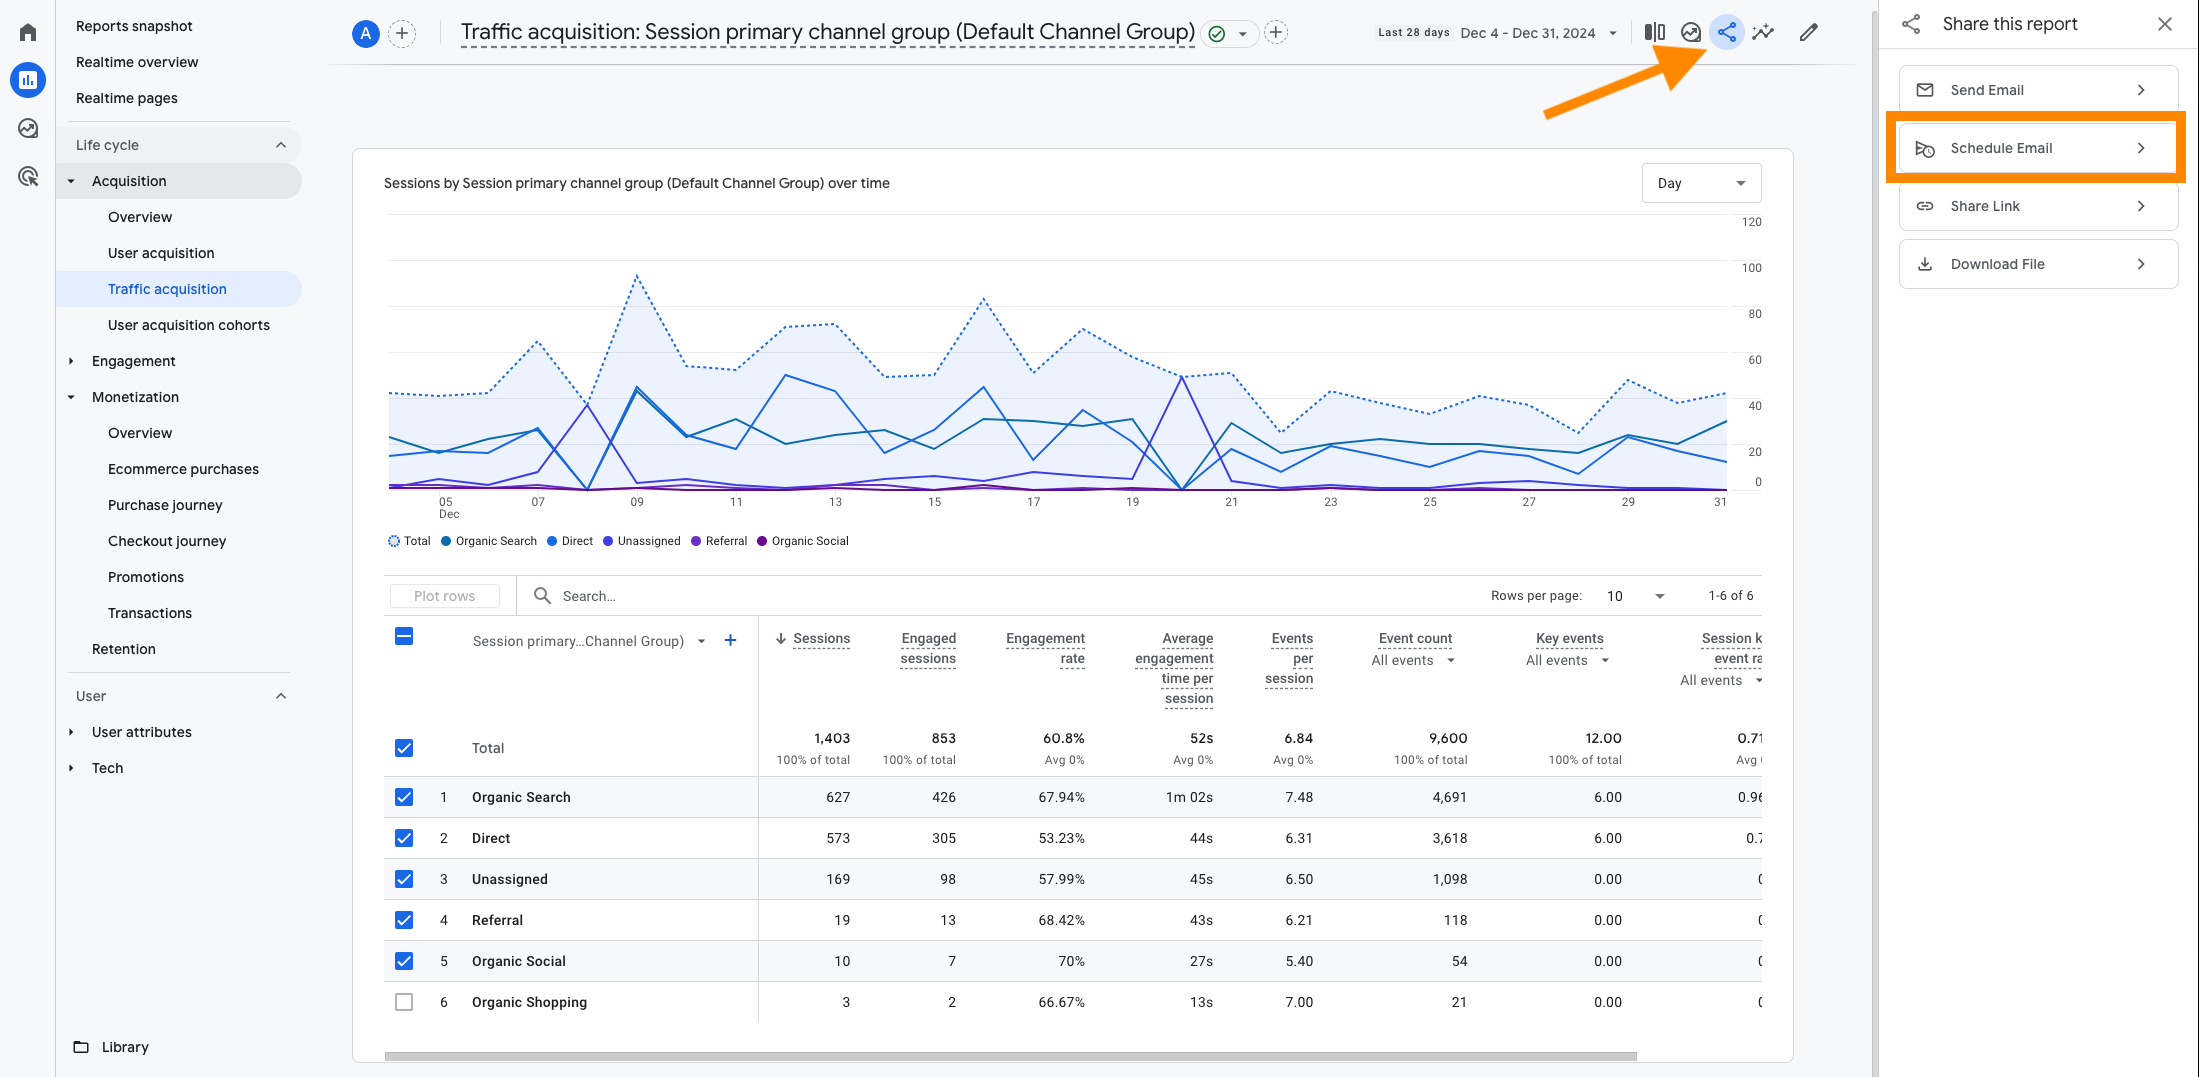
Once you get comfortable with what you're looking for, note that you can schedule a regular send of any report by clicking the 'share' icon, as shown below.
I would start by getting a baseline for your monthly sessions, then you can dial it as you and your team get into a rhythm for analysis.
Commerce7
There are two main options here, either run a report by channel (seen below) or run a query where channel = 'Web'.
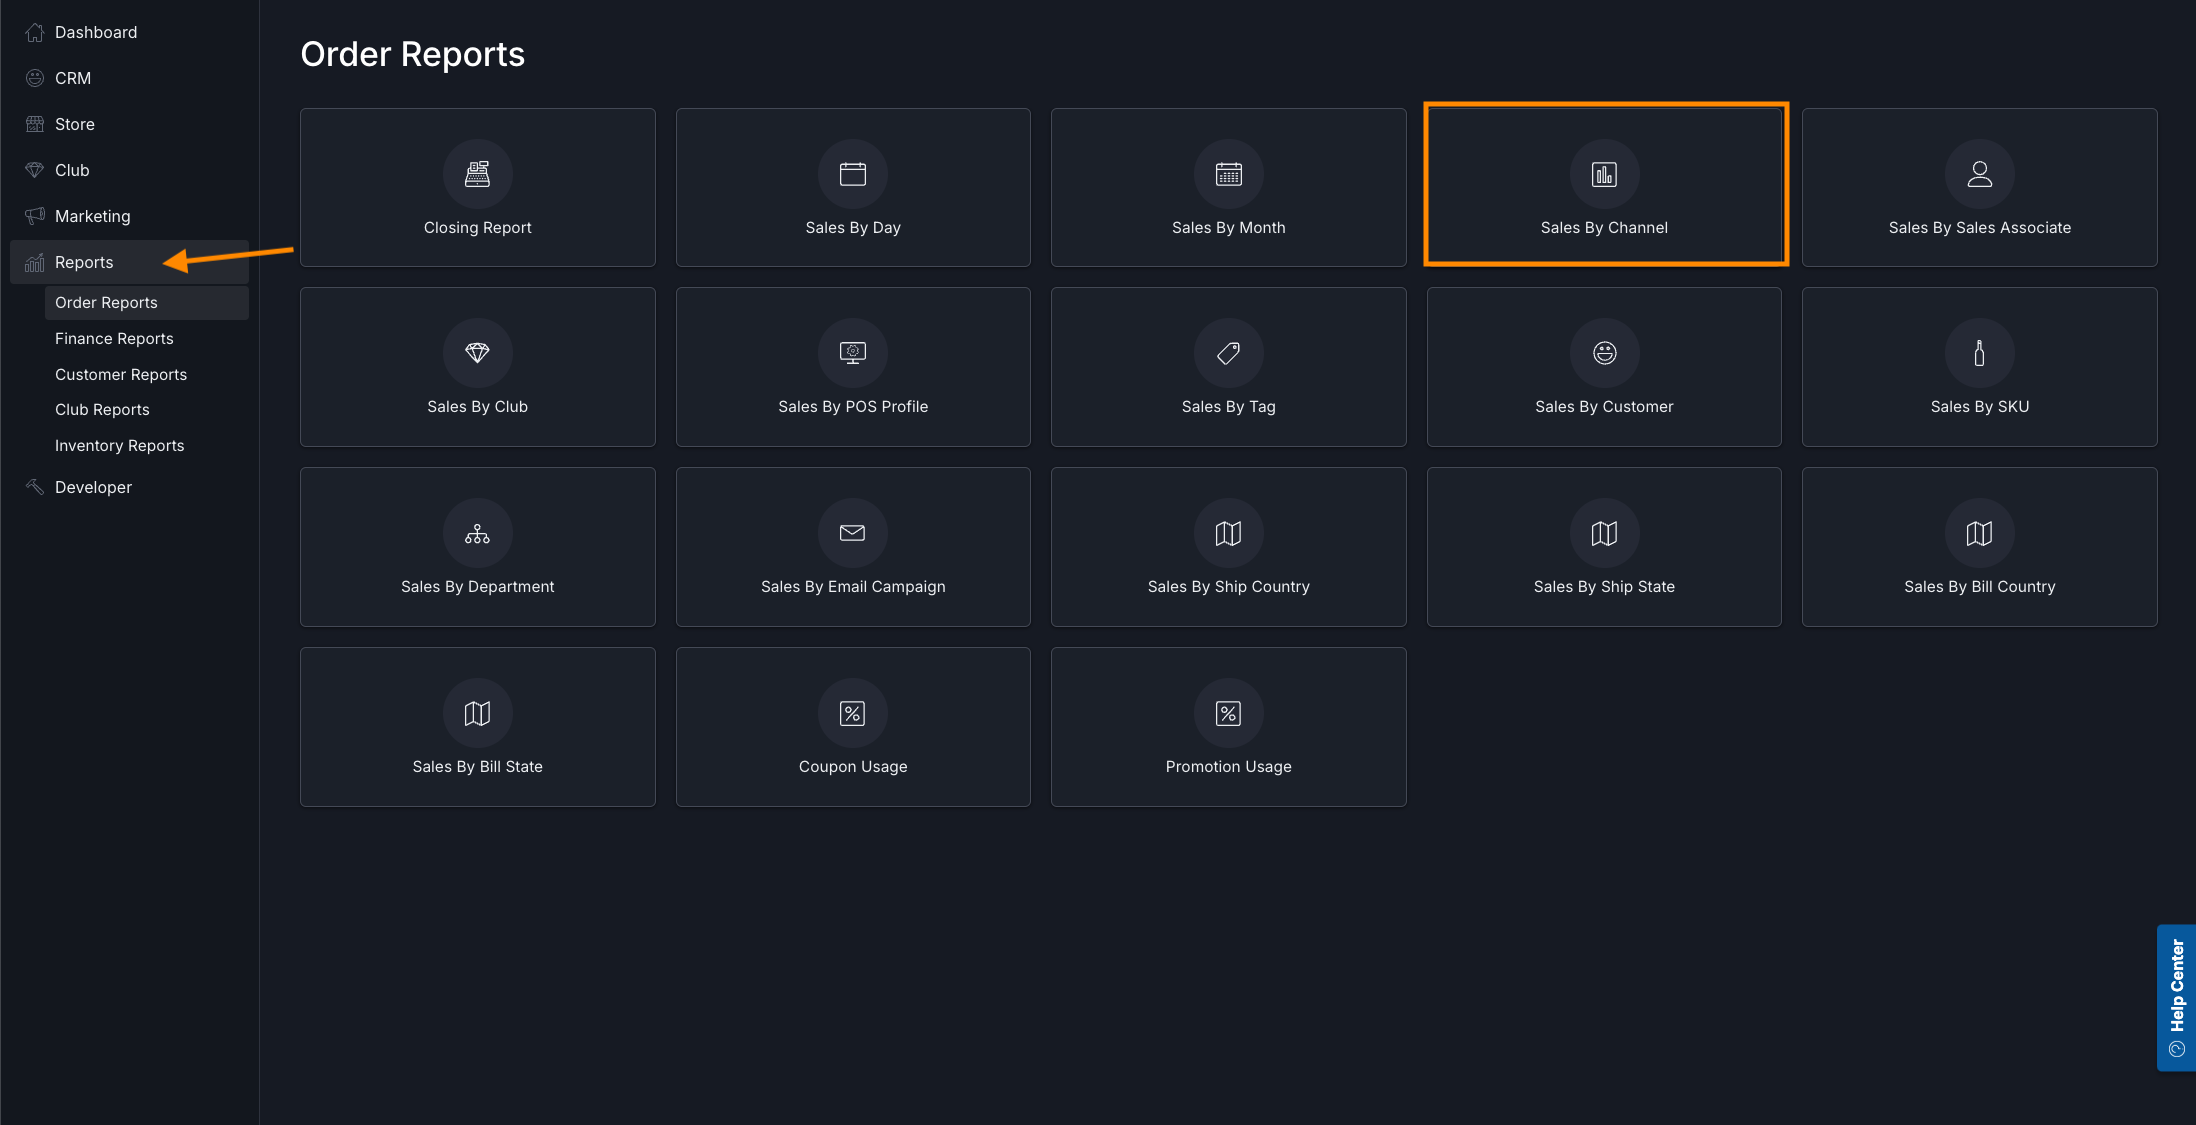
Once you have both of these, for the same time period, simply divide the revenue by the sessions and you have your RPS!
Taking Action on Your RPS Data
Once you're tracking RPS, here's how to use it:
First, remember that RPS is a high-level metric that should be used as one indicator of top-line success. In order for it to mean anything, it needs to be incorporated with other leading and lagging indicators that you manage to influence RPS.
Fundamentally, our goal is make our website sell more, which will come down to the same two principles we mentioned earlier: improving traffic quality and increasing conversion.
Next, figure out of if you have conversion tracking properly set up on your website. A good place to start is to cross-reference your web revenue with the e-commerce purchases in Google Analytics. They won't match perfectly, as GA likely won't know about refunds (unless you set this up), but at least knowing which sessions led to purchases (and where they came from) is an important step for further marketing analytics.
This process is intimidating on the surface, but it's usually some unglamorous, simple work in Google Tag Manager to set up events. Let me know if you want a tutorial on that.
If you have conversion tracking set up:
For example, you might create an exploration in GA like the one below that breaks out the engaged session by source/medium, so you can start to figure out where you get the highest RPS.
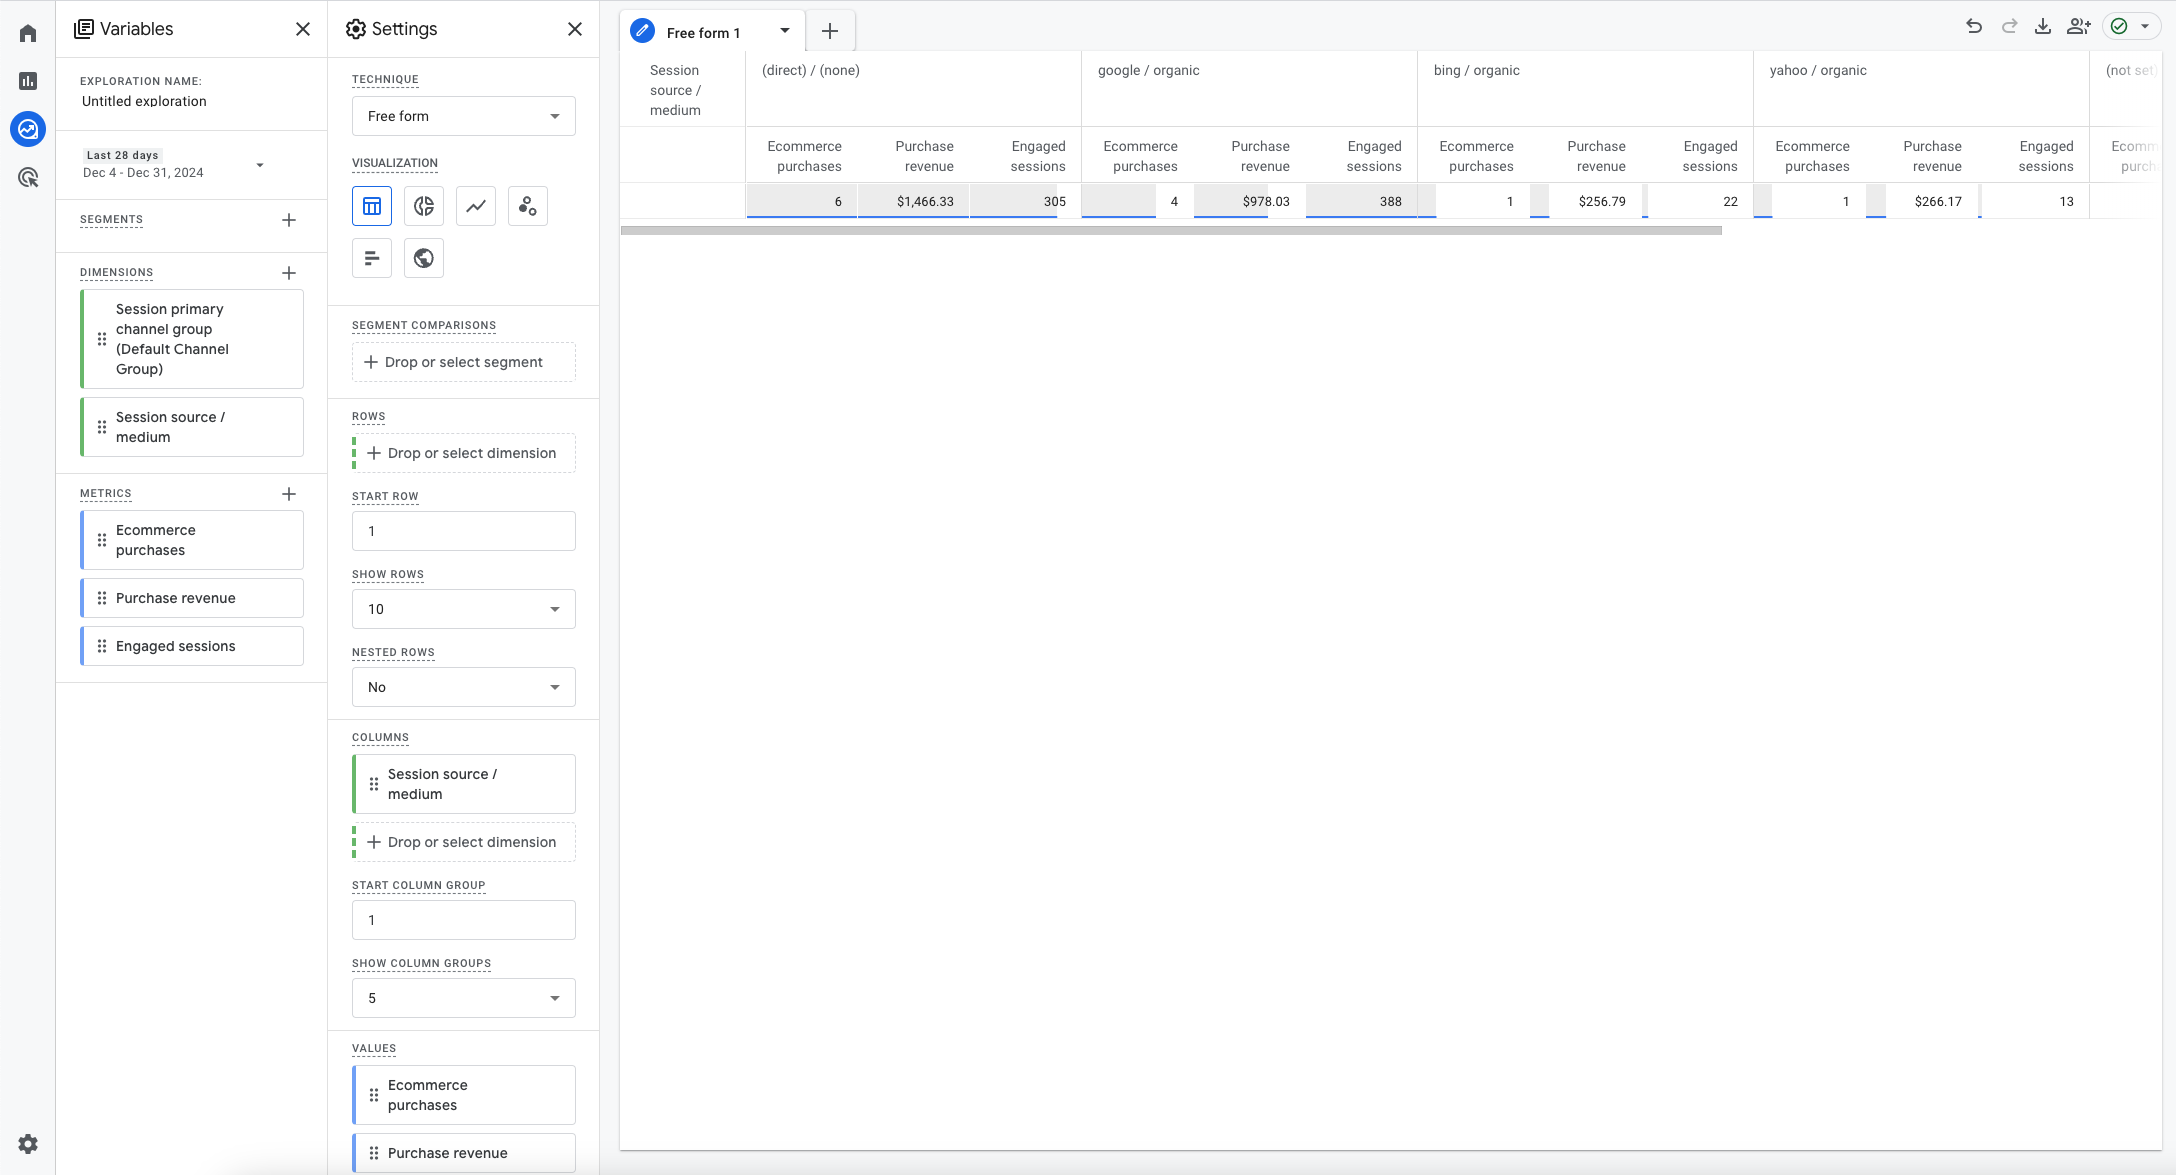
As you gather signal here, you should work to optimize traffic quality. Just as you might adjust your tasting room marketing to attract more qualified visitors, you can optimize your digital traffic sources. If email-driven sessions achieve an RPS of $65 while paid social delivers $25, this suggests where to focus your digital marketing efforts.
Bonus points here if you are tracking campaign-level performance.
One of the great advantages of selling online is that you can measure quite a bit more than you can in person.
Take the example below, which is just an out-of-the-box report from GA showing the purchase journey from the previous month. About half of the users were on mobile, only 5% of all users who viewed a product added it to their cart, and only 3/7 users who did add a product to their cart actually initiated checkout.
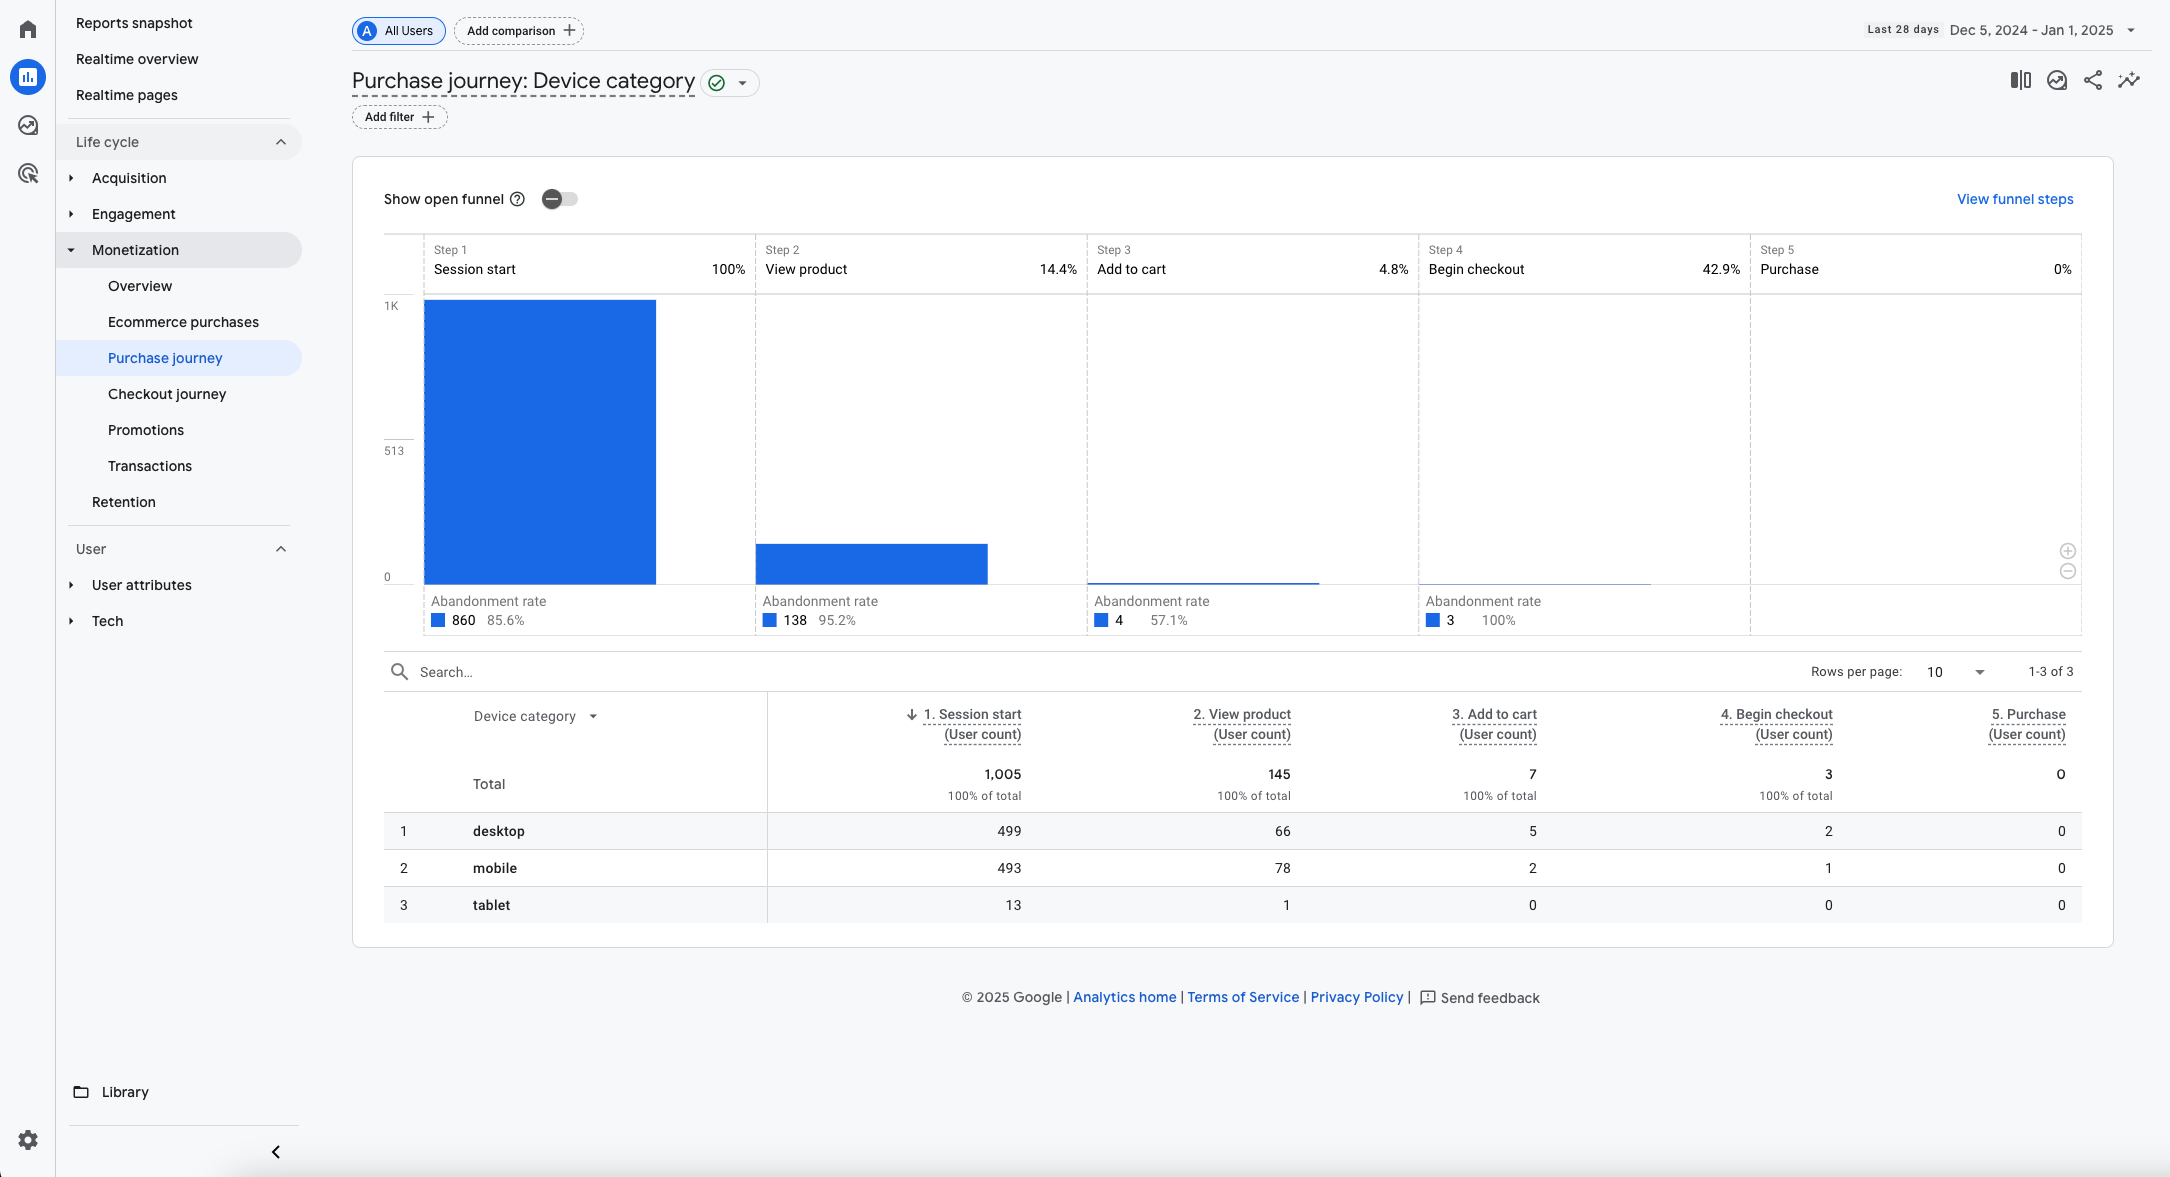
Consider building out funnels for each of your key conversions (ex. reservations, wine club sign up, etc.) and stack ranking where your biggest points of friction are. We then want to design changes to the website experience that would remove those points of friction, little by little, and see which changes lead to a reduction in abandonment rate (as pictured above), which should lead to an increase in RPS.
If you don't have conversion tracking set up:
Your team has plenty of experience with shopping online, you are expert consumers so put that hat on and start with figuring out where there's friction in your website experience.
Have your team do the same and build a list of the specific parts of your shopping experience that could be improved.
I like to use the "Mom Test", where I imagine my mom (lovely, but not the most tech-savvy) interacting with a digital experience. If I don't think she can navigate the experience and achieve the desired goal (ex. add to cart and checkout in X time) without instruction, then it's not intuitive enough.
Once you have your prioritized list, begin brainstorming what changes might address that part of the site experience. Do not proceed until you have success criteria to measure the efficacy of the change (ex. abandonment rate).
I'm a fan of getting feedback that is as close to the source as humanly possible, ideally at a high volume.
If you want to see how complete strangers interact with your site, consider one of these options:
- conduct 10 video calls with customers, per task you want to test
- focus on one key task per call
- standardize the task for all participants
- record the call
- do not tell them how to do it, your job is to observe and ask debrief questions after
- ex. "find a wine you think you'll like, that you haven't tried before, and check out"
- use a platform like UserTesting.com to get complete strangers to shop your site
- this is a productized version of your own manual video calls
- install a tool like Hotjar to capture a visual representation of how people interact with your site
- use heatmaps (below) to see where users are spending the most time on your site
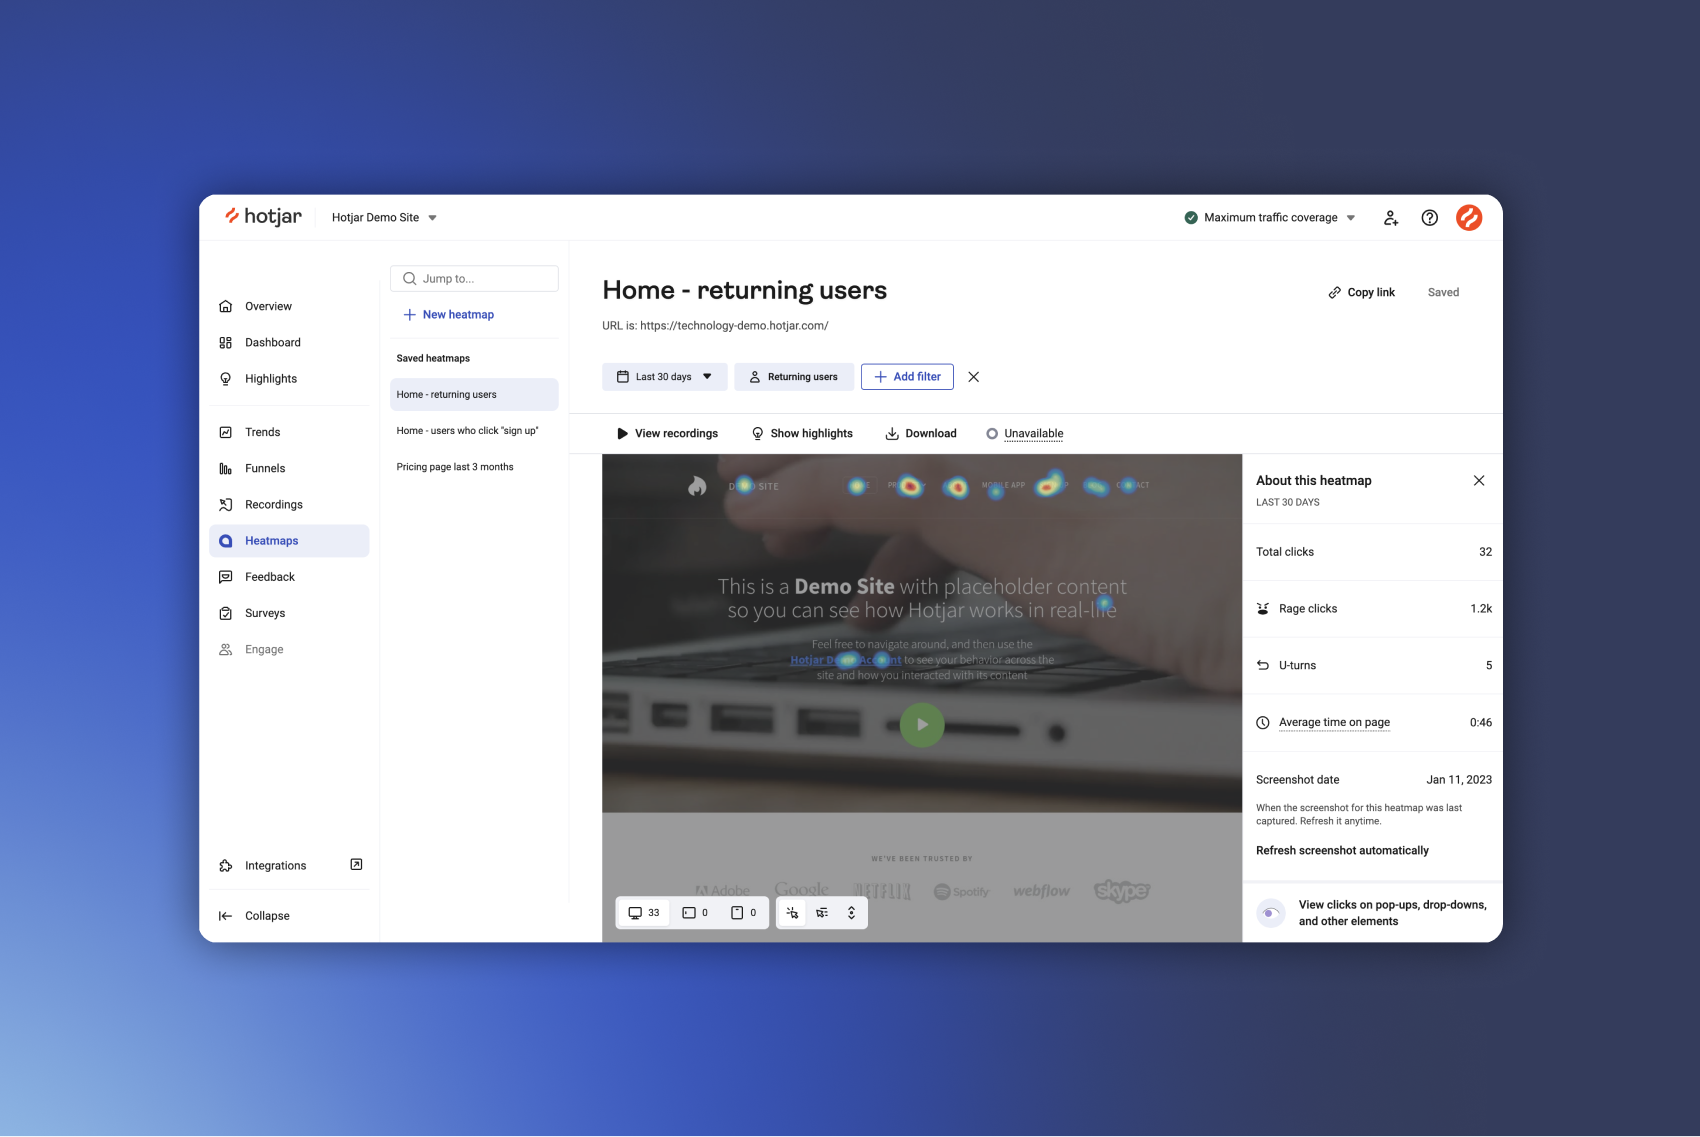
- watch recordings to see where people are getting stuck
Important Considerations
While RPS is powerful, keep these points in mind:
- Seasonal variations are normal and expected, just as you see in your tasting room.
- Focus on improving your own baseline rather than chasing industry benchmarks (which are hard to find/trust anyway).
- Remember that some visitors are looking for information rather than making purchases.
- Use RPS alongside, not instead of, your existing metrics.
2025 and Beyond
As we kickoff the new year, the wineries that thrive will be those that bring the same analytical rigor to their digital presence that they apply to their tasting rooms. Revenue per session isn't just another metric – it's your gateway to understanding and optimizing your digital DTC channel.
Just as you track metrics in your tasting room to improve, don't let another year go by without deepening your understanding of how your website is performing. RPS is a great metric to start down the path of growing your digital presence in 2025 and beyond.
Hope this helped,
Stephen

Comments ()